
Cost Structures and Price Trends
Get comprehensive visibility into the cost, margin, drivers, and price trends behind every category
Talk To Our Team
Cost and price intelligence you can act on
A category’s cost structure shows what sits behind a price, while price trends show how the price has moved and where it is heading. Understanding both is foundational to category strategy, as together they reveal where the greatest leverage lies and the basis on which price increases are assessed, savings opportunities are identified, suppliers are benchmarked, and cost and price movement is explained internally.
Beroe’s decision-grade cost structures and price trends show your team what makes up a price and how it is moving, across direct and indirect categories, so you can negotiate, budget, and plan from data rather than assumption.
9,000+
1,600+
22,500+
What our cost structures and price trends cover

Nine cost components

Sub-component detail

Margin analysis

Regional comparison

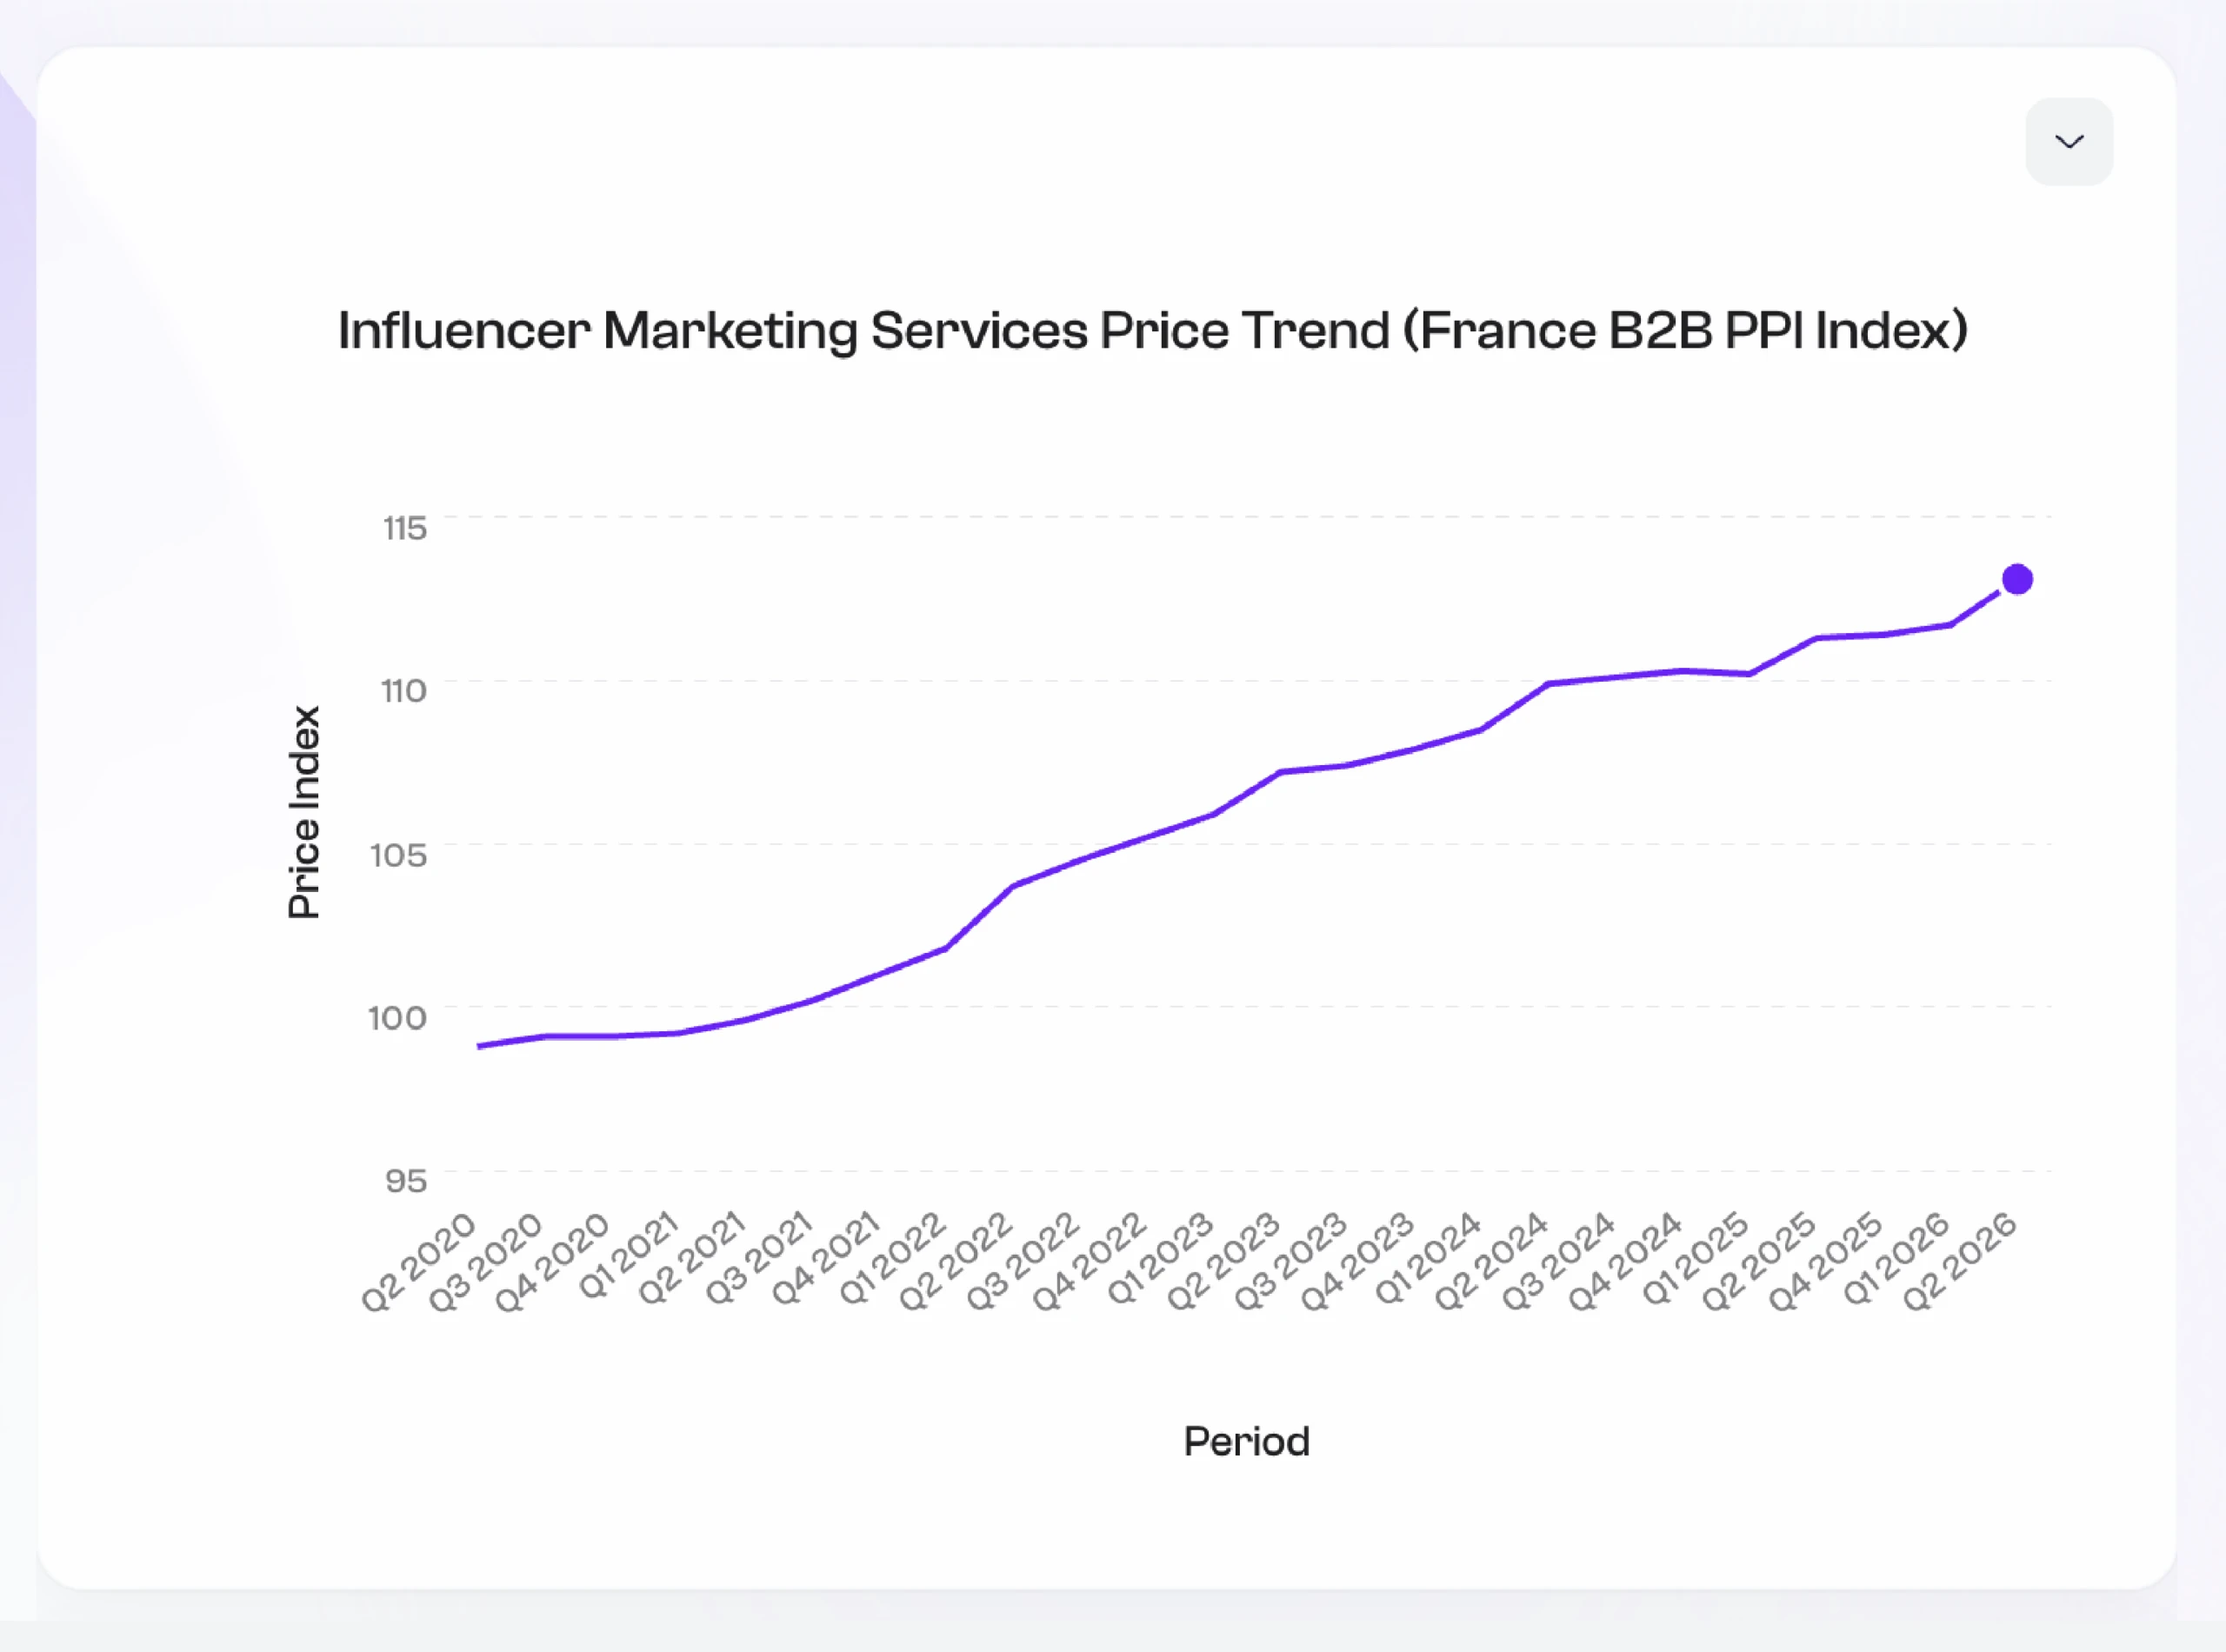
Price trends

Access cost structures and price trends wherever you make decisions
Ask Beroe abi directly and get instant answers, or see the cost breakdown and price trends in our dashboards.
Pull cost and price data directly into your enterprise systems, procurement workflows and AI agents via APIs and MCP server.
Why Beroe

Decision-grade intelligence
Every cost structure and price trend is validated by category analysts, so the numbers hold up when a supplier or internal stakeholder questions them.

Negotiation backed by cost and price data
Accurate cost and price data supports your position in a supplier negotiation, down to the level of individual cost elements and the trend behind the price.
Procurement-native intelligence
Beroe has 20 years of procurement experience, and the world’s largest enterprises trust us to deliver on it.

Resources and Insights

Procurement in flux: How strategic priorities are shifting amid market volatility

AI That Actually Works: Why MCP Integration is a Turning Point for Procurement Data

Beroe Enhances Inflation Watch to Transform Enterprise Cost Intelligence and Inflation Risk Management

From Reactive to Ready: How Procurement Teams Are Getting Ahead of Inflation
Questions procurement teams ask about cost structures and price trends
A cost structure is a breakdown of the elements that make up a product’s or service’s price, such as materials, labor, energy, overheads, and supplier margin. Knowing what sits behind a price shows procurement teams where their greatest leverage lies and gives them a basis for assessing price increases and identifying savings. Beroe offers more than 9,000 cost structures across more than 1,600 direct and indirect categories.
A cost structure shows what makes up a price, while a price trend shows how that price has moved over time and where it is heading. Each answers a different question, and procurement teams need both to build a sound category strategy. Beroe pairs cost breakdowns with historical and forecasted prices across regions and time periods, so teams can explain cost and price movements internally and plan from data.
Every Beroe cost structure is broken into nine top-level components: direct materials or services, labor, energy and utilities, SG&A, R&D expenses, maintenance and repair, overheads, depreciation, and net margin. Teams can expand any component to see its underlying elements, each with its own percentage contribution. They can also compare cost contributions globally and across major regions to find more competitive sourcing locations.
Cost structure analysis shows whether a supplier’s proposed increase matches the actual movement in its underlying costs. For example, if energy makes up a small share of a product’s cost, a sharp rise in energy prices should justify only a modest increase in the final price. Beroe’s margin analysis also gives insight into supplier profitability. Every cost structure is validated by category analysts, so the numbers hold up when a supplier or stakeholder questions them.
A should-cost model is a bottom-up estimate of what a product or service should cost to produce, built from its inputs, processes, and a reasonable margin. Cost structures show category-level proportions, while a should-cost model goes deeper into one specific item. That makes it especially useful for high-value or complex purchases. Beroe provides should-cost modeling through Beroe Bespoke for teams that need this level of precision.
